


Special offers from our partners!

Find Replacement BBQ Parts for 20,308 Models. Repair your BBQ today.

Note
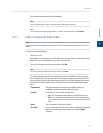
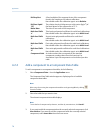
Other ways of accessing the component data tables are by pressing F6 or by clicking
from the Toolbar.
2. Select the table that you want to view.
The selected component data table displays.
Note
To sort the list of components by detector, and then by retention time, click Sort RT.
3. Click Std Values (F3).
The Standard Component Values window displays.
4. When you are finished viewing the window, click Close.
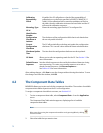
4.2.5 Display raw data from the Component Data table
To view the raw data for the displayed component data table, do the following:
1. Select Component Data... from the Application menu.
The Component Data window displays.
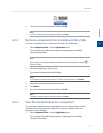
2. Click Raw Data (F4) or press F4.
The Select dialog displays, listing the streams that are associated with the
component data table.
3. Double-click the desired stream.
The Raw Data window appears, listing the peak raw data from the last run of the
stream represented by the component data table.
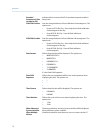
The following data displays for each peak:
Peak No. Numerical identifier for the peak, listed by the order of
discovery.
Ret Time Time, in seconds, that the component eluted.
Peak Area The area under the peak.
Peak Height The maximum height of the peak.
Det The detector associated with the peak.
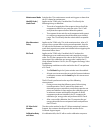
Method Method of peak end detection. Options are:
• 1 (Baseline). Baseline termination occurs when the absolute
values of twelve successive slope calculations are less than
the slope sensitivity.
Application
78