


Special offers from our partners!

Find Replacement BBQ Parts for 20,308 Models. Repair your BBQ today.
a. Enter a start time in the Start Time column.
b. Enter an interval, in hours, in the Interval column.
4. Use the columns numbered 1 through 20 to select the streams that you want to use
for data collection.
5. Click OK to save the changes and close the window.
Note
To save the changes without closing the window, click Save.
5.8 Trend data
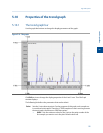
This function allows you to view, print, or save graphical representations, or trend lines, of
accumulated analysis data from the GC.
5.8.1 View live trend data
Note
You cannot view a live trend if the corresponding analysis record does not exist in the GC’s memory.
To view live trend data, do the following:
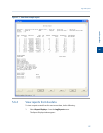
1. Select Trend Data... from the Logs/Reports menu.
The Trend Data window displays.
2. Click Trend.
The Select records for Trending window displays.
3. Select the analysis or calibration records that you want to trend from the Select
Analysis/Calibration Records selection menu. Click > to move your selection to the
Selected Records queue.
4. If applicable, select the type of average record that you want to trend from the
Select Average Records section. Click > to move your selection to the Selected
Records queue.
Note
To remove a selection from the Selected Records queue, click Remove. To remove all
selections from the Selected Records queue, click Remove All.
5. Click the All Records checkbox from the Trend Record Selection section to use all
data for the trend report, or click the Time Period checkbox and select a Start Date
and End Date for the data to be used.
6. Click Trend.
Logs and reports
132