


Special offers from our partners!

Find Replacement BBQ Parts for 20,308 Models. Repair your BBQ today.

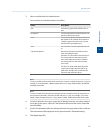
Scroll newest X Determined whether the graph’s window moves to focus on the most
recent data point along the X-axis.
The default value is Checked.
To accept your changes, click OK.
Click Cursor to toggle the cursor size from coarse movement (less accurate) to fine
movement (more accurate).
Click Print to print the graph window.
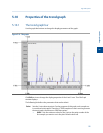
5.11 The Trend bar
The Trend bar contains a row of buttons that allows you to manipulate a single trend trace.
Below the row of buttons is the trace pull-down menu, which contains a list of all of the
currently displayed traces that make up the trend graph. Before you can work with a trend
trace you must first select it from the pull-down menu.
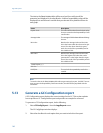
5.11.1 Edit a trend graph
You can use the Edit window to change the X and Y offset values for a graph, change its
color, and also set which Y axis should be used when plotting it. These changes may be
necessary to make the trend more distinguishable from those that surround it, or to
position a graph in relation to a different graph for comparison.
To edit a trend trace, do the following:
1. From the Trend pull-down menu, select the graph that you want to edit.
2. Click Edit.
The Edit Trend dialog displays.
X Offset Enter a positive number to move the trend to the right, or a
negative number to move the trend to the left.
Y Offset Enter a positive number to move the trend up, or a negative
number to move the trend down.
Color Assigns a color to the trend.
Add Trace to Sets which Y axis should be used when plotting the graph. See
Section 5.10.1 for more information.
3. Click OK to accept your changes.
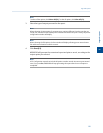
5.11.2 Enter a description for a trend graph
To add or change description text for a trend graph, do the following:
1. From the Trend bar, click Desc.
The Edit Description window displays.
Logs and reports
5
Logs and reports
137