


Special offers from our partners!

Find Replacement BBQ Parts for 20,308 Models. Repair your BBQ today.
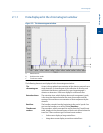
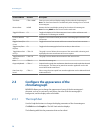
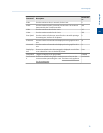
2.1.1 Data displayed in the chromatogram window
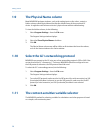
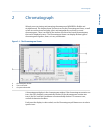
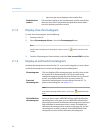
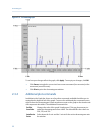
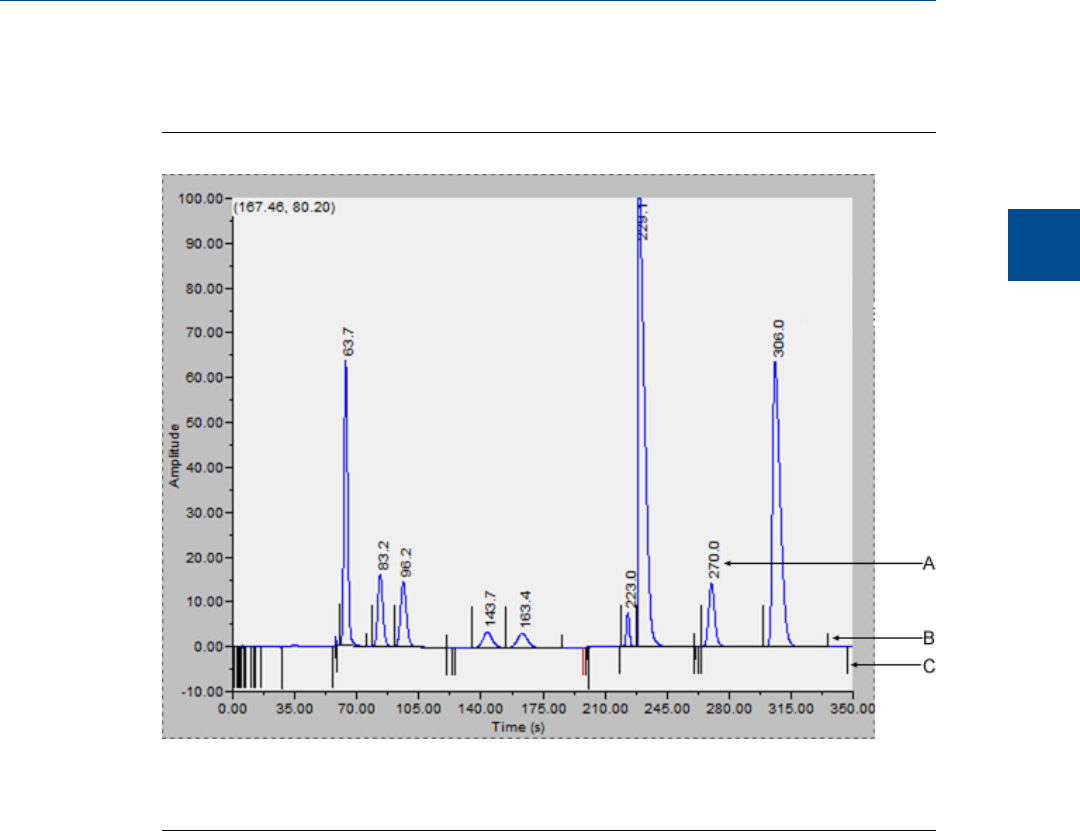
The chromatogram windowFigure 2-3:
A. Retention time
B. Peak detection marker
C. Timed event marker
The following elements are displayed in the chromatogram window:
The
chromatogram
A trace is the graphical representation of the detector output from a
single detector; a chromatogram is the collection of all traces and
associated data that are generated by a gas chromatograph’s
detector or detectors. Each trace displays in a different color.
Retention times The retention time, which displays above each component's peak,
is the time that elapses between the start of an analysis and the
sensing of the maximum concentration of that component by the
detector.
Baselines The baseline extends from the beginning to the end of a peak. You
can turn the baseline on or off by clicking Baselines.
Timed event
markers
These markers, which correspond to events from the Timed Events
table, display on the chromatogram as black vertical lines below the
trace-line. There are three types of timed event markers:
• Valve events display as long vertical lines.
• Integration events display as medium vertical lines.
Chromatograph
2
Chromatograph
25