


Special offers from our partners!

Find Replacement BBQ Parts for 20,308 Models. Repair your BBQ today.
Note
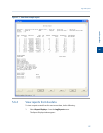
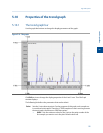
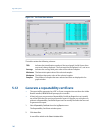
When the Selected Data checkbox is selected, the small table to the right
of the graph displays the trend data for the visible area of the graph when
zooming in and out.
Save State Shortcut: CTRL + HOME
Saves current or archived display settings for the selected trend
graph.
Note
The Save State function is available only when viewing a live or archived
trend graph.
Restore State Shortcut: HOME
Restores the last saved display settings for the selected trend graph.
Note
Pressing HOME returns the user to the saved state.
Toggle Full
Screen
Shortcut: F11
Maximizes the display of the graph in the Trend Data window.
Cursor to Nearest
Point
Shortcut: F8
Snaps the cursor to the nearest point on the trend graph in both the
X and Y directions.
Toggle Coarse/
Fine Cursor
Shortcut: F4
Toggles the cursor from coarse and less accurate to fine and more
accurate.
Toggle Lines/Dots
Displays
Shortcut: F9
Toggles the trend graph from lines to dots, or dots to lines.
Toggle Mouse
Position Tip
Shortcut: CTRL + F4
The graph’s cursor follows the movement of the mouse while a
hovering Tooltip displays the exact coordinates of the current point.
Toggle Nearest
Position Tip
Shortcut: CTRL + F9
The graph’s cursor follows the movement of the mouse cursor.
Print Shortcut: CTRL + P
Prints the trend graph.
Copy to clipboard Shortcut: CTRL + C
Copies from the graph the raw detector data that was used to plot
the selected trend graph. This data can be pasted into another
application such as Microsoft Word
®
or Microsoft Excel
®
.
Paste from
clipboard
Shortcut: CTRL + V
Plots a range of points copied from another application such as
Microsoft Word
®
or Microsoft Excel
®
.
Logs and reports
134