Special offers from our partners!

Find Replacement BBQ Parts for 20,308 Models. Repair your BBQ today.
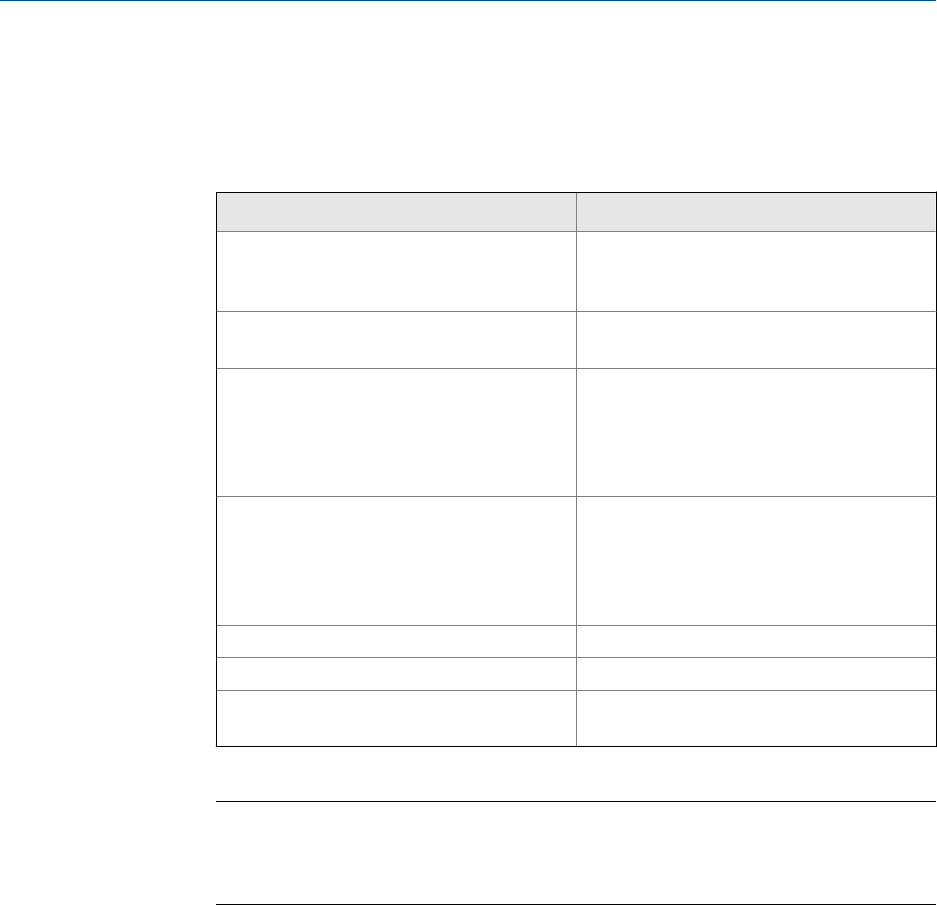
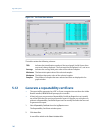
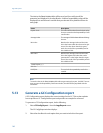
The data in the Select Variables table will be saved and the certificate will be
generated and displayed in Acrobat Reader. A table of repeatability values will be
displayed first and then each variable that you selected to be plotted will have its
own graph.
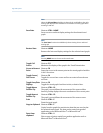
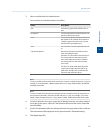
Name Description
Repeat. Limit This value will be taken from the Limit value
that you entered on the Repeatability Certifi-
cate window.
Average Value The average of all the data collected during
the test.
Min Value Based on the Average Value and the Limit,
this is the lowest valid value that can be gen-
erated. If a value lower than this is gener-
ated, the result of the repeatability test for
this variable is FAIL.
Max Value Based on the Average Value and the Limit,
this is the highest valid value that can be
generated. If a value higher than this is gen-
erated, the result of the repeatability test for
this variable is FAIL.
Tested Repeat (+/-)
Std. Dev.
PASS/FAIL The result of the repeatability test for this
variable.
Note
To save the data in the Select Variables table without generating the report, click OK. The next
time you open the Repeatability Certificate window, the table will be populated with the
saved data.
5.13 Generate a GC Configuration report
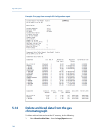
A GC Configuration report displays the current settings for the GC. This section explains
how to produce a GC Configuration report and provides an example for reference.
To generate a GC Configuration report, do the following:
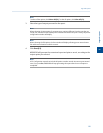
1. Select GC Config Report... from the Logs/Reports menu.
The GC Config Report window displays.
2. Select the checkbox for each option that you want to include in the report.
Logs and reports
142


