


Special offers from our partners!

Find Replacement BBQ Parts for 20,308 Models. Repair your BBQ today.

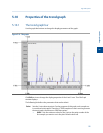
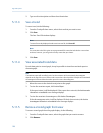
5.11.6 Refresh a trend graph
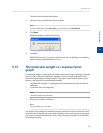
1. From the Trend pull-down menu, select the trace that you want to refresh.
2. Click Refresh.
The trend graph will be updated with any new data that was compiled since the
most recent refresh.
5.11.7 Display trend data
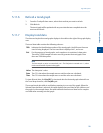
The data used to plot the trend graphs displays in the table to the right of the graph display
area.
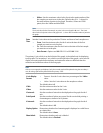
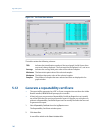
The trend data table contains the following columns:
TRD Indicates the identification number of the trend graph. Useful if more than one
trend is being displayed. The first trend that is displayed is #1, and so on.
Pt # For the purposes of trend graphs, each sample run is considered a data point.
Therefore, if 2500 sample runs were used to generate the trend graph, then
there are 2500 data points.
Note
The first sample, or point, is counted as 0, not 1. The final point is counted as N - 1, where
N is the total number of points in the graph.
Value The data point’s value.
Data The GC’s date when the sample was run and the value was calculated.
Time The GC’s time when the sample was run and the value was calculated.
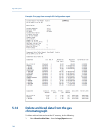
To view all trend data, click Cur/All. To view trend data for the trend graph selected from
the Trend drop-down list, click Cur/All again.
The second trend data table is useful when zooming in to or out of the graph. When the
Selected Data checkbox is selected, this table displays the trend data for the visible area of
the graph. As the example shows, the table indicates that the trend data for five samples
are visible after zooming in to the graph.
Logs and reports
5
Logs and reports
139