


Special offers from our partners!

Find Replacement BBQ Parts for 20,308 Models. Repair your BBQ today.
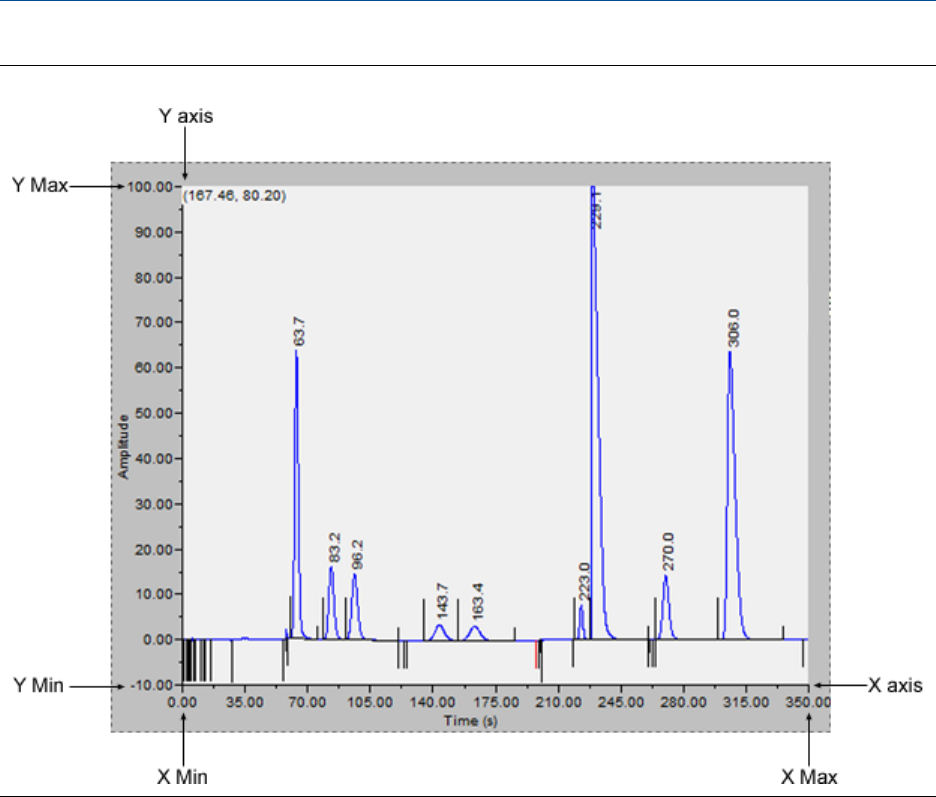
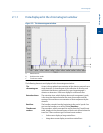
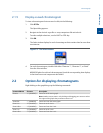
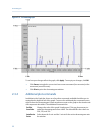
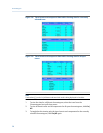
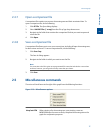
A chromatographFigure 2-6:
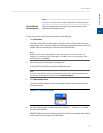
To see how your changes affect the graph, click Apply. To accept your changes, click OK.
• Click Cursor to toggle the cursor size from coarse movement (less accurate) to fine
movement (more accurate).
• Click Print to print the chromatogram window.
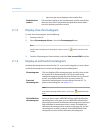
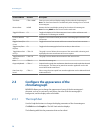
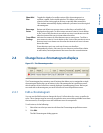
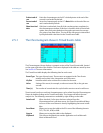
2.3.2 Additional plot commands
In addition to the Graph bar, there are a few other commands available that allow you to
manipulate the look and feel of the graph. To access the additional plot commands menu,
right-click on the Chromatogram Viewer anywhere except on the graph or the timed event
and component data tables. The additional commands are:
Set Plot
Area Color
Changes the color of the graph’s background. This may be necessary to
make the chromatograms more visible. The default RGB color values are
236, 233, and 216.
Auto Resize
Series
Scales down the X-axis and the Y-axis to fit the entire chromatogram onto
the window.
Chromatograph
32