


Special offers from our partners!

Find Replacement BBQ Parts for 20,308 Models. Repair your BBQ today.

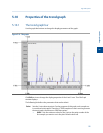
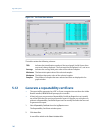
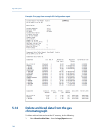
The Trend Data windowFigure 5-9:
The table contains the following columns:
TRD Indicates the identification number of the trend graph. Useful if more than
one trend is being displayed. The first trend that is displayed is #1, and so on.
Average Indicates the average data point value of the selected samples.
Minimum The lowest data point value of the selected samples.
Maximum The highest data point value of the selected samples.
Samples The number of samples that were selected and that are displayed in the
graph window.
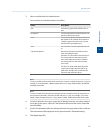
5.12 Generate a repeatability certificate
• The report will be generated as a PDF so if your computer does not have the Adobe
Reader installed, MON2020 will prompt you to install it.
• A Read-only user can generate a Repeatability Certificate Report but can't modify
any of the fields that are used to generate the report. A Regular user or higher can
generate a Repeatability Certificate Report and can modify the fields that are used
to generate the report.
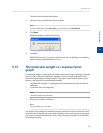
1. Select Repeatability Certificate from the Log/Reports menu.
The Repeatability Certificate window opens.
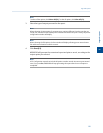
2. Click Insert After.
A row will be added to the Select Variables table.
Logs and reports
140