


Special offers from our partners!

Find Replacement BBQ Parts for 20,308 Models. Repair your BBQ today.
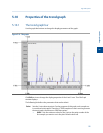
• X Max - Sets the maximum value for the X axis to the point number of the
last sample you want to use in the plot. Default value is N - 1, where N is
the total number of points in the graph. Therefore, if there are 2500
points, then the X Max would be 2499.
Note
The X-axis value for the first sample, or point, in the trend graph is 0, not 1. The X-axis
value for the final point in the trend graph is N - 1, where N is the total number of points in
the graph.
Date
Time
Sets the X-axis values to the particular GC dates and times of each sample runs.
• From - Sets the minimum value for the X axis to the date of the first
sample you want to use in the plot.
• To - Sets the maximum value for the X axis to the date of the last sample
you want to use in the plot.
• Date Format - Options are MM-DD-YYYY or DD-MM-YYYY.
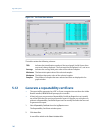
The primary Y axis, which is on the left side of the graph, is the default axis for displaying
trend graphs. The secondary Y axis, which is on the right side of the graph, can be used to
display a second graph whose minimum and maximum values are different than the
minimum and maximum values of the first graph.
Note
If three or more graphs are displayed, only the second graph will be plotted using the secondary Y
axis; all other graphs will be plotted with the primary Y axis.
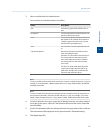
Y axis Display
Format
• Percent - Sets the Y-axis values to a percentage of the Y Max
value.
• Value - Sets the Y-axis values to the sample run values.
The default value is 0.
Y Min Sets the minimum value for the Y axis.
Y Max Sets the maximum value for the Y axis.
Y Intervals Sets the number of intervals to be displayed on the graph for the Y
axis.
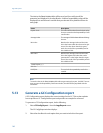
Print Speed Sets the number of inches per second for the x-axis while printing a
chromatogram, similar to an XY plotter.
X Intervals Sets the number of intervals to be displayed on the graph for the X
axis.
The default value is 10.
Display Option Determines whether the chromatograph is displayed as a solid line or
as a dotted line.
The default value is Lines.
Show labels Determines whether each axis is labeled.
The default value is Checked.
Logs and reports
136